What Does “99% Purity” Actually Mean?
A purity number can look definitive. Understanding what it actually tells you requires looking at the analytical method behind it.
By The Vault Journal Editorial Team · Published September 12, 2026 · 7–9 min read
Published by The Vault Journal — A Bio Vault Labs Publication
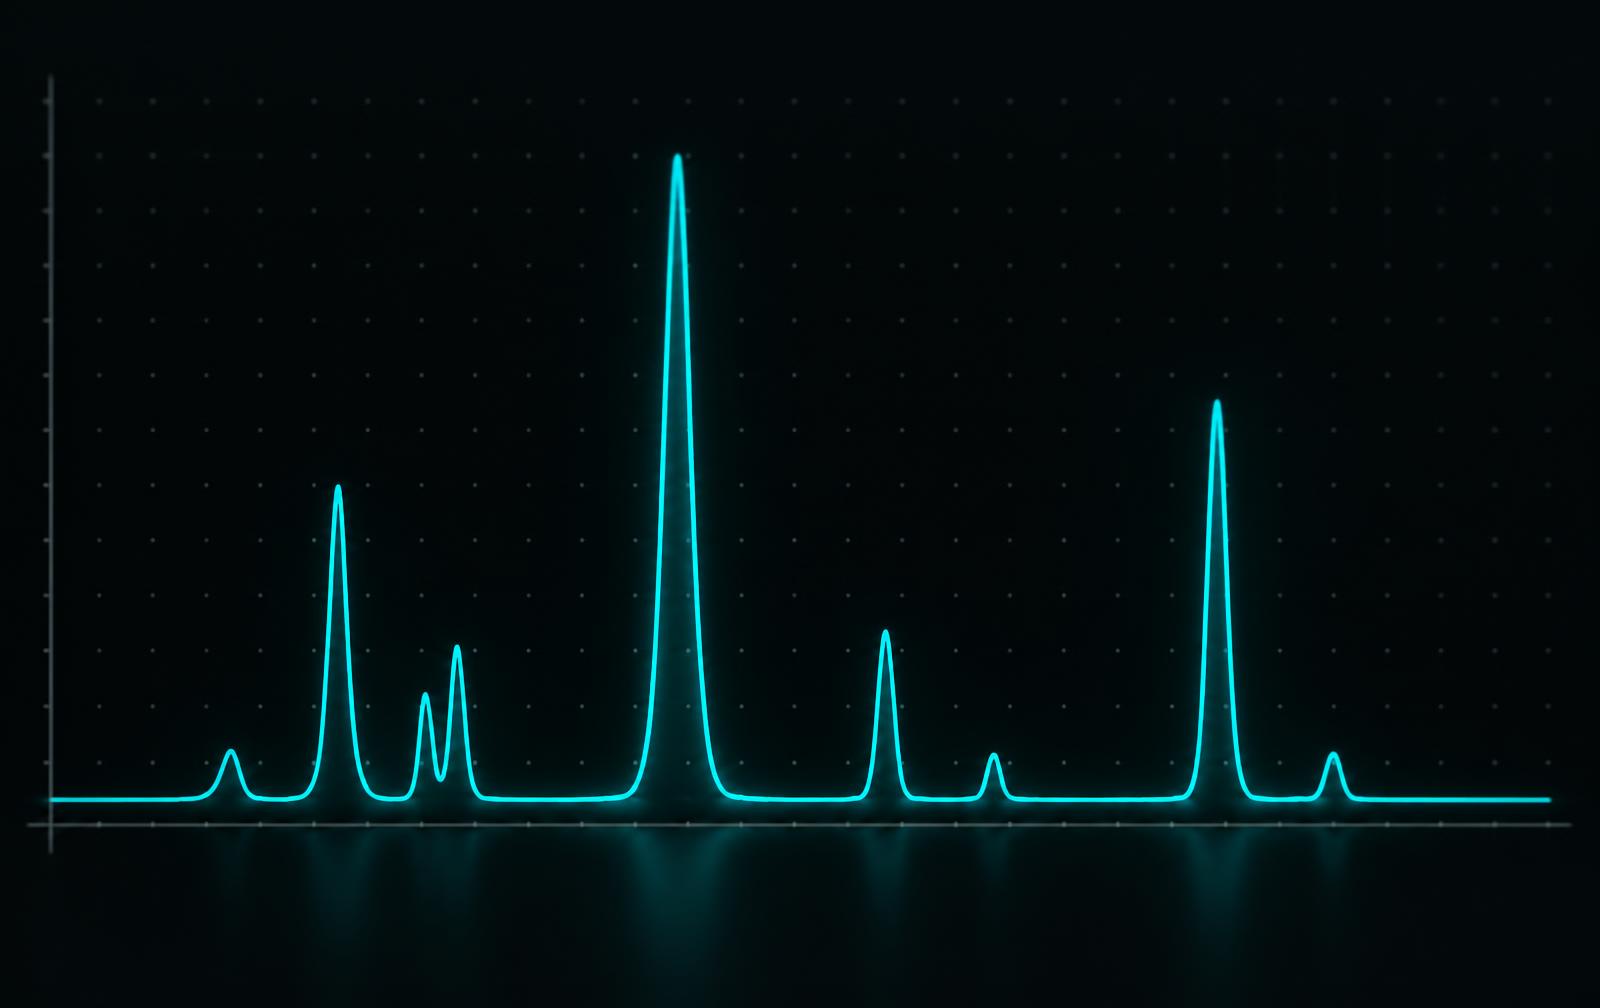
Few numbers on a laboratory report look as settled as a purity percentage.
“99% pure.” Two digits, a percent sign, and an apparent verdict.
But that simplicity hides a much more interesting question:
99% of what — and according to which measurement?
Analytical numbers do not exist independently of the methods that produce them. A purity percentage is not a property a substance carries around with it. It is the result of a particular measurement, performed with particular instruments, under particular conditions, to answer a particular question.
Change the method and the number can change with it. That is not a flaw in analytical science. It is how measurement works — and understanding it turns a single line on a report into something far more informative.
The Number That Looks Simple
To a non-specialist, “99% purity” reads like a straightforward statement about composition: almost all of the material is the thing it is supposed to be, and a small remainder is something else.
That reading assumes the number is an absolute description of everything present in the sample. It usually is not.
A reported analytical result describes what a chosen method was able to measure. Anything the method does not separate, does not detect, or was not designed to look for does not appear in the number at all.
So the percentage is real information. It is simply conditional information, and interpreting it requires knowing the conditions.
What Does “Purity” Mean in Analytical Chemistry?
In everyday language, “pure” means unmixed. In analytical chemistry, purity is expressed as a measured quantity — and what that quantity represents depends on how it was determined.
Two laboratories can both report “purity” and be describing meaningfully different things, because the result depends on choices such as:
- Analytical technique — Chromatography, spectroscopy, and mass spectrometry answer different questions about the same sample.
- Detector — Detection depends on a physical property, and not every substance produces a comparable response.
- Sample preparation — Dissolution, dilution, filtration, and handling all shape what actually reaches the instrument.
- Measurement conditions — Column, mobile phase, temperature, and run time influence what becomes separated and visible.
- Calculation approach — A result may be expressed relative to total detected response, or against a calibrated standard, and these are not equivalent.
- Reference standards — Whether a suitable reference material was used, and how, affects what the number can support.
- What the method can detect at all — Anything outside the method's scope cannot contribute to the figure reported.
None of this makes purity figures unreliable. It means a percentage should be read alongside the method that produced it, in the same way a measurement in a scientific paper is read alongside its methods section.
Where Does a Number Like 99% Come From?
Many reported purity values come from chromatography, and in particular from high-performance liquid chromatography (HPLC) — a separation technique in which components of a mixture are distributed between a stationary phase and a moving mobile phase, and therefore travel through the system at different rates.[1,2]
Conceptually, the path from sample to number looks like this:
- Sample — A measured amount of material is prepared and introduced into the instrument.
- Separation — Components interact differently with the column and become separated in time.
- Detector — A response is measured as separated components leave the column.
- Chromatogram — The detector signal is recorded over time as a trace containing peaks.
- Interpretation — Peaks are identified, integrated, and evaluated according to the analytical method.
In some analytical approaches, the relative areas of chromatographic peaks are used to estimate relative composition. In others, response is compared against a calibrated reference standard to quantify a specific analyte.
These are different calculations that can both end up expressed as a percentage. That is why it is inaccurate to assume every reported HPLC purity figure was produced the same way.
For a fuller walkthrough of the technique itself, see What Is HPLC? Understanding High-Performance Liquid Chromatography.
Reading a Chromatogram, Conceptually
A chromatogram is not a picture of a sample. It is a record of detector response plotted against time.
Two features carry most of the meaning:
- Retention time — When a component emerges from the column under the defined conditions. Under consistent conditions it can be compared with the behaviour of a reference standard.
- Peak — A region of elevated detector response. Its size reflects how strongly the detector responded, not simply how much material was present.
Because response depends on the detector and the substance, two components present in equal amounts can produce peaks of noticeably different size. Two components can also emerge close together and be incompletely separated.
This is why chromatograms are interpreted by analysts working within a defined method, rather than read off at a glance.
Purity Is Not the Same Question as Identity
This is the distinction that most often gets lost.
Estimating how much of a detected signal is associated with a particular peak is one analytical question. Establishing what that peak chemically is is a different analytical question.
An imperfect analogy: a room could be described as 99% occupied by people wearing blue shirts. That proportion says nothing about who those people are, and the description depends entirely on someone standing at the door counting shirts. The analogy breaks down quickly — chromatographic separation is far more selective than shirt colour — but it captures the essential point that a proportion and an identification are not interchangeable.
In practice, retention-time comparison against an appropriate reference standard supports identification, and techniques such as mass spectrometry or spectroscopic detection can provide structural information that chromatographic area alone cannot. Analytical guidance treats identification and quantitation as distinct performance characteristics of a procedure, each requiring evidence that the method is suitable for that purpose.[3]
Different questions call for complementary methods. A single number rarely answers all of them.
What HPLC Can Tell Us
None of this diminishes chromatography, which is one of the most powerful analytical tools available. Used within a suitable method, it can help researchers:
- Separate components within a mixture so they can be examined individually.
- Compare retention behaviour under defined and reproducible conditions.
- Quantify a specific analyte when the method has been developed and validated for that purpose.[3,4]
- Evaluate the compositional profile of a sample, including the presence of additional detected peaks.
- Monitor analytical consistency between samples, batches, or time points.
These are substantial capabilities. They are also specific ones — which is precisely what makes chromatographic data scientifically useful.
What One Purity Number Can’t Tell Us
A single reported percentage does not, on its own, establish every property that matters about a sample. Limitations worth holding in mind include:
- Chemical identity — Area alone does not confirm what a peak is.
- Undetected substances — Anything that does not respond to the detector, or does not elute under the conditions used, contributes nothing to the figure.
- Detector selectivity — Detection reflects a physical property, not a universal census of contents.
- Method scope — A procedure designed for one analytical question is not automatically suitable for another.[4]
- Sample preparation — What was tested is what was prepared, which may not represent the whole material.
- Measurement uncertainty — Every measurement has associated uncertainty, and a percentage reported without it is incomplete information.
- Validation status — Whether the procedure was demonstrated to be fit for its intended analytical purpose is part of what makes a result interpretable.[3]
The point is not that laboratory results should be distrusted. It is that a result is a scientific statement with a defined scope, and reading it well means respecting that scope.
Why the Detector Matters
An analytical instrument does not perceive substances. It measures a signal.
A detector responds to a specific physical characteristic — how strongly a substance absorbs light at a chosen wavelength, for example, or a property related to its mass. Substances that share that characteristic produce a response. Substances that do not are effectively invisible to that measurement, no matter how well the separation worked.
The consequence is that peak areas are comparable in a meaningful way only within the context of the detector and conditions used. Interpreting them as direct proportions of mass, without supporting method information, imports an assumption the data may not carry.
What Are Reference Standards?
Analytical measurement is comparative. To say something about an unknown, a laboratory generally needs something sufficiently characterised to compare it against — a reference material or reference standard.
Reference materials support several distinct functions:
- Comparison — Providing known behaviour, such as retention time, against which a sample can be evaluated.
- Calibration — Relating an instrument's response to a known quantity so results can be expressed on a defined scale.
- Traceability — Connecting a measurement result to recognised references, which in measurement science has a specific metrological meaning.[5]
- Method performance — Supporting assessment of whether a procedure behaves as intended.
Institutions including NIST and USP produce and document reference materials for exactly these purposes, along with the documentation that describes their characterised properties and appropriate use.[5,6,7]
Importantly, the existence of a reference standard does not by itself validate a result. What matters is whether an appropriate standard was used appropriately, within a method suited to the question being asked.
Why Two “99%” Results May Not Mean the Same Thing
Two reports can display the same percentage and still not be analytically equivalent, because the figure is downstream of many decisions:
- The analytical technique and specific method used.
- The detector and its operating conditions.
- Chromatographic conditions such as column, mobile phase, and gradient.
- Whether the result reflects relative peak area or calibrated quantitation.
- How calibration was performed.
- Which reference material was used, if any.
- Laboratory procedures, including sample preparation and integration practice.
- The measurement uncertainty associated with the result.
The conclusion is not that laboratory results are meaningless. Quite the opposite: analytical measurement is meaningful because it is method-dependent and documented.
The conclusion is that scientific measurements require context, and that identical-looking numbers can carry different amounts of evidence behind them.
Reading a Purity Claim More Critically
A short set of questions turns a percentage back into science. When you encounter an analytical purity figure, it is reasonable to ask:
- What analytical method produced this number?
- What exactly was being measured — a proportion of detected response, or a quantified analyte?
- What detector was used, and under what conditions?
- Was an appropriate reference standard involved, and how?
- What can this method detect?
- What might it not detect?
- Was the method validated for the analytical purpose it is being used for?
- Does the report address purity, identity, or both — and with what evidence for each?
This is a framework for interpreting scientific measurement, not for assessing whether any material is suitable to obtain, use, or consume. Those are entirely separate questions governed by separate evidence and separate expertise.
How This Connects to a Certificate of Analysis
Purity figures usually appear inside a larger document, and the same reasoning applies there.
A Certificate of Analysis is best read as a collection of analytical information — identification of the material, the tests performed, the methods used, the specifications applied, the results obtained, and the laboratory responsible — rather than being reduced to whichever number appears largest on the page.
The percentage is one line of evidence among several. Our guide How to Read a Certificate of Analysis walks through the rest of the document and what each element does and does not establish.
And because the substances described in these documents are often peptides, it helps to be clear about what those molecules are in the first place: Peptides vs. Proteins: What’s the Difference?.
The Takeaway
“99% pure.”
The number can contain genuinely useful analytical information. But its meaning comes from the science behind it — the method, the detector, the conditions, the standards, and the question the measurement was designed to answer.
A number fits neatly into a single line on a report. The science behind that number rarely does.
So when you next see a purity percentage, ask the obvious question — and then the better one:
“How was it measured?”
Reference
Key Terms
- Analytical Purity
- A measured result describing composition as determined by a specific analytical method, rather than an absolute account of everything present in a sample.
- Chromatogram
- A record of detector response plotted against time during a chromatographic separation.
- Retention Time
- The time at which a component emerges from a chromatographic column under defined conditions; comparable between runs only when those conditions are consistent.
- Peak Area
- The integrated detector response associated with a chromatographic peak. It reflects detector response, which is not necessarily proportional to mass across different substances.
- Detector Selectivity
- The extent to which a detector responds to some substances and not others, determining what a given measurement is capable of revealing.
- Reference Standard
- A sufficiently characterised material used for comparison, calibration, or evaluation of method performance in analytical measurement.
- Metrological Traceability
- The documented, unbroken chain of comparisons relating a measurement result to a stated reference, each with associated measurement uncertainty.
- Method Validation
- The process of demonstrating that an analytical procedure is suitable for its intended analytical purpose.
- Measurement Uncertainty
- A quantitative expression of the range of values reasonably attributable to a measurement result.
References
- [1] International Union of Pure and Applied Chemistry (IUPAC). Compendium of Chemical Terminology (Gold Book): Liquid Chromatography.
- [2] National Institute of Standards and Technology (NIST). Lane C. Sander. Liquid Chromatography: Introduction and Instrumentation.
- [3] U.S. Food and Drug Administration / ICH. Q2(R2): Validation of Analytical Procedures. Final Guidance, March 2024.
- [4] U.S. Food and Drug Administration / ICH. Q14: Analytical Procedure Development. Final Guidance, March 2024.
- [5] National Institute of Standards and Technology (NIST). Metrological Traceability: Frequently Asked Questions and NIST Policy.
- [6] National Institute of Standards and Technology (NIST). Reference Materials. Overview of Standard Reference Materials, certification, and measurement uncertainty.
- [7] United States Pharmacopeia (USP). Reference Standards. Overview of USP Reference Standards and their role in analytical testing.
This article is for educational and informational purposes only. It does not provide medical advice, diagnosis, or treatment recommendations.
Back to the journalContinue Reading
Related Stories
Lab Science
What Is HPLC? Understanding High-Performance Liquid Chromatography
HPLC separates components within a liquid sample so researchers can examine them individually. Learn how the technique works, what a chromatogram shows, and why understanding the analytical method matters.
By The Vault Journal Editorial Team · 6–8 min read

Lab Science
How to Read a Certificate of Analysis
A Certificate of Analysis contains more than a headline percentage. Learn how to evaluate batch information, analytical methods, specifications, results, reference standards, and traceability.
By The Vault Journal Editorial Team · 7–9 min read
Molecular Biology
Peptides vs. Proteins: What's the Difference?
Peptides and proteins are both built from amino acids, but they aren't interchangeable terms. Learn how chain length, sequence, folding, structure, and biological context distinguish them.
By The Vault Journal Editorial Team · 6–8 min read